

Toronto Bike Repair
Toronto bike repair is a bike service shop in the heart of GTA on Bloor street. It is owned by a Greek person who is kind, funny and sincere towards his customers. He started this bike shop by himself so we can say “shop local”. They repair all sorts of bikes but they are specialized in vintage bike. They sell bikes and bike parts. The mechanics are here from all over the world which makes it a fun place to be. It looks like a mini world. They prioritise their customers and do custom work as well just to make them happy. Through my research on designing, demographics and branding I created this responsive website which will meet the requirements of Toronto bike repair and their customers.
Project overview
Challenge
Toronto Bike repair is a small, one man owned business. His business is totally rely on word to word marketing. However, they have potential to build their online presence and grow their business with a new website.
Solution
Design a website that meets the goals of the business and user.
New branding that effectively communicates Toronto Bike Repair’s unique personality.
Role
UI/UX Designer
time
4 weeks
task
Design a shipping app where users can help each other with sending and bringing stuff at minimal charges.
tools
Figma, Photoshop, Illustrator
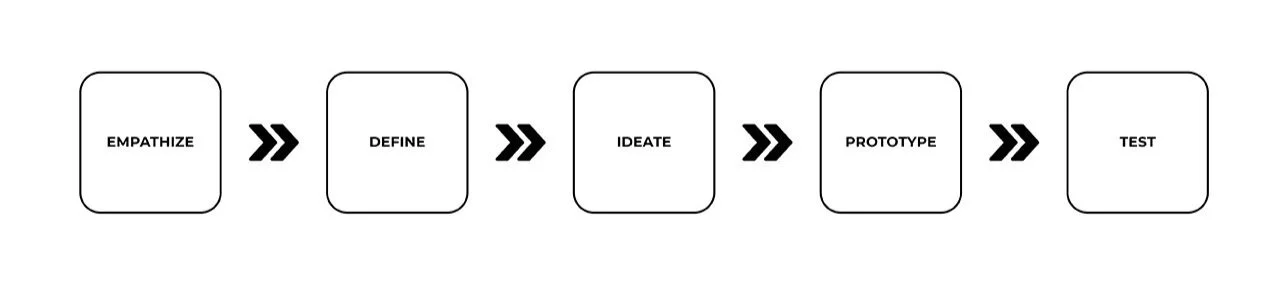
My Process
empathy
research
Through market research, competitive analysis, and user interviews, I set out to gain a deeper understanding of the market and Toronto Bike Repair’s customers.
In preparation for diving into my research, I first set some clear goals and created a research plan that would guide my research process
Through my research, I wanted to:
Understand the market trends of the bike repair industry.
Identify TBR’s target market.
Identify TBR’s competitors and evaluate strengths and weaknesses.
Understand how people discover new, local businesses.
Understand the experiences people have online and offline.
Discover pain points that people encounter online and offline.
market research
I started with market research to understand the general market, consumer, and business trends to gain a fuller understanding of the market Toronto Bike Repair is part of.
market TRENDS
The market is projected to grow from USD 97.20 billion in 2020 to USD 147.24 billion in 2027 growing at a CAGR of 6.1% in 2020-2027.
People use bicycles for their daily commute purposes and other activities such as exercise, sports, and hiking. The growing awareness regarding the health benefits of paddling among the people is primarily driving the demand.
In September 2020, the City of Austin, Government of Texas, U.S. partnered with Austin-based Capital Metropolitan Transportation Authority to revamp an ‘Austin Bicycle’ Bike share program that includes the installation of a newer bike station in the city.
Giant Bicycles; Merida Industry Co., Ltd; and Trek Bicycle Corporation. These companies are investing aggressively; launching new products; introducing new services, such as home delivery of high-end bicycles, after-sales support, and maintenance; and pricing their products and services competitively to retain their competitiveness.
Ascending order the most famous types of bikes are road bicycles, mountain bikes, hybrid bikes and other
gender insights
The men's segment accounted for the largest market share of 45.0% in 2020.
In 2018, on average, the U.K. male population within the age group of 40 to 49 made 35 cycling trips in a year over that of 15 trips by female population within a similar age group.
The women segment is projected to witness steady growth. It is anticipated to expand at a CAGR of over 6.8% over the forecast period.
The kids & women segment is expected to showcase considerable growth during the forecast period owing to the increasing trend of holiday bicycling among households in countries such as the U.S., Denmark, Norway, and others.
Men are more likely to bicycle to work than women (10.2% of men’s cycling trips versus 6.24% of women’s cycling trips)
Women are more likely than men to ride a bicycle to school as a student (1.2% versus 0.58%), to do shopping and errands (2.64% versus 1.11%), and to visit friends and relatives (4.53% versus 2.76%).
regional insights
Asia Pacific emerged as the dominant segment in 2020 with a revenue share exceeding 33%.
The region is also expected to emerge as the fastest-growing segment expanding at a CAGR of over 8.0% in the forthcoming years. Nations, such as China, Japan, and Singapore, emphasize rolling out the infrastructure necessary to encourage and support bicycle commutation.
In 2018, on average, over four-fifths of cycling took place on minor rural roads, and 58% on minor urban roads per year by people of Great Britain for their daily commutation purposes.
In 2019, Asia Pacific stood at USD 22.83 billion. The largest share of the Asia Pacific region is attributed to the presence of large production facilities in countries such as China, Japan, and India.
In May 2020, the U.K. government proposed spending nearly USD 2,000 million in developing cycling and walking infrastructural facilities in the U.K.
According to the data presented by the Ministry of Foreign Affairs Government of the Netherlands, in 2018, there were 22.13 million units of bicycles imported into Argentina, compared to 17.09 million units in 2017.
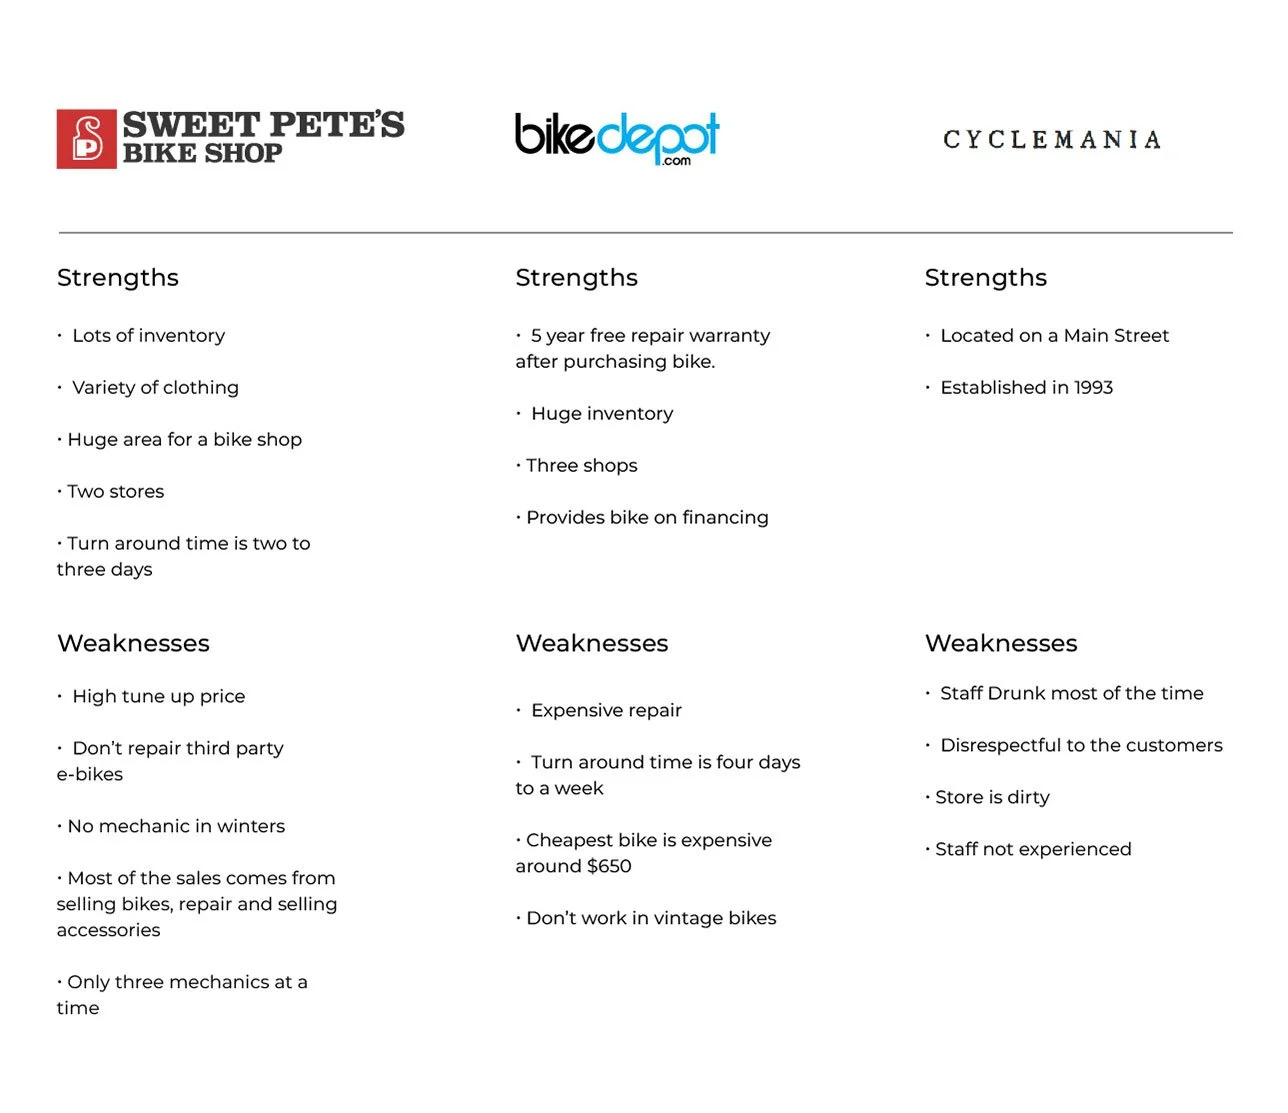
Competitive Analysis
As I spent more time in my research I found out about PARSAL competitors and how they are helping their customers. As PARSAL business model is quite different from the shipping companies which found to put them in the indirect category. And i.e. FedEx, DHL, UPS, AEC. Their. The direct focus is on shipping. Exploring each of their apps, I evaluated the strengths and weaknesses of each to see how PARSAL can move forward seamlessly.
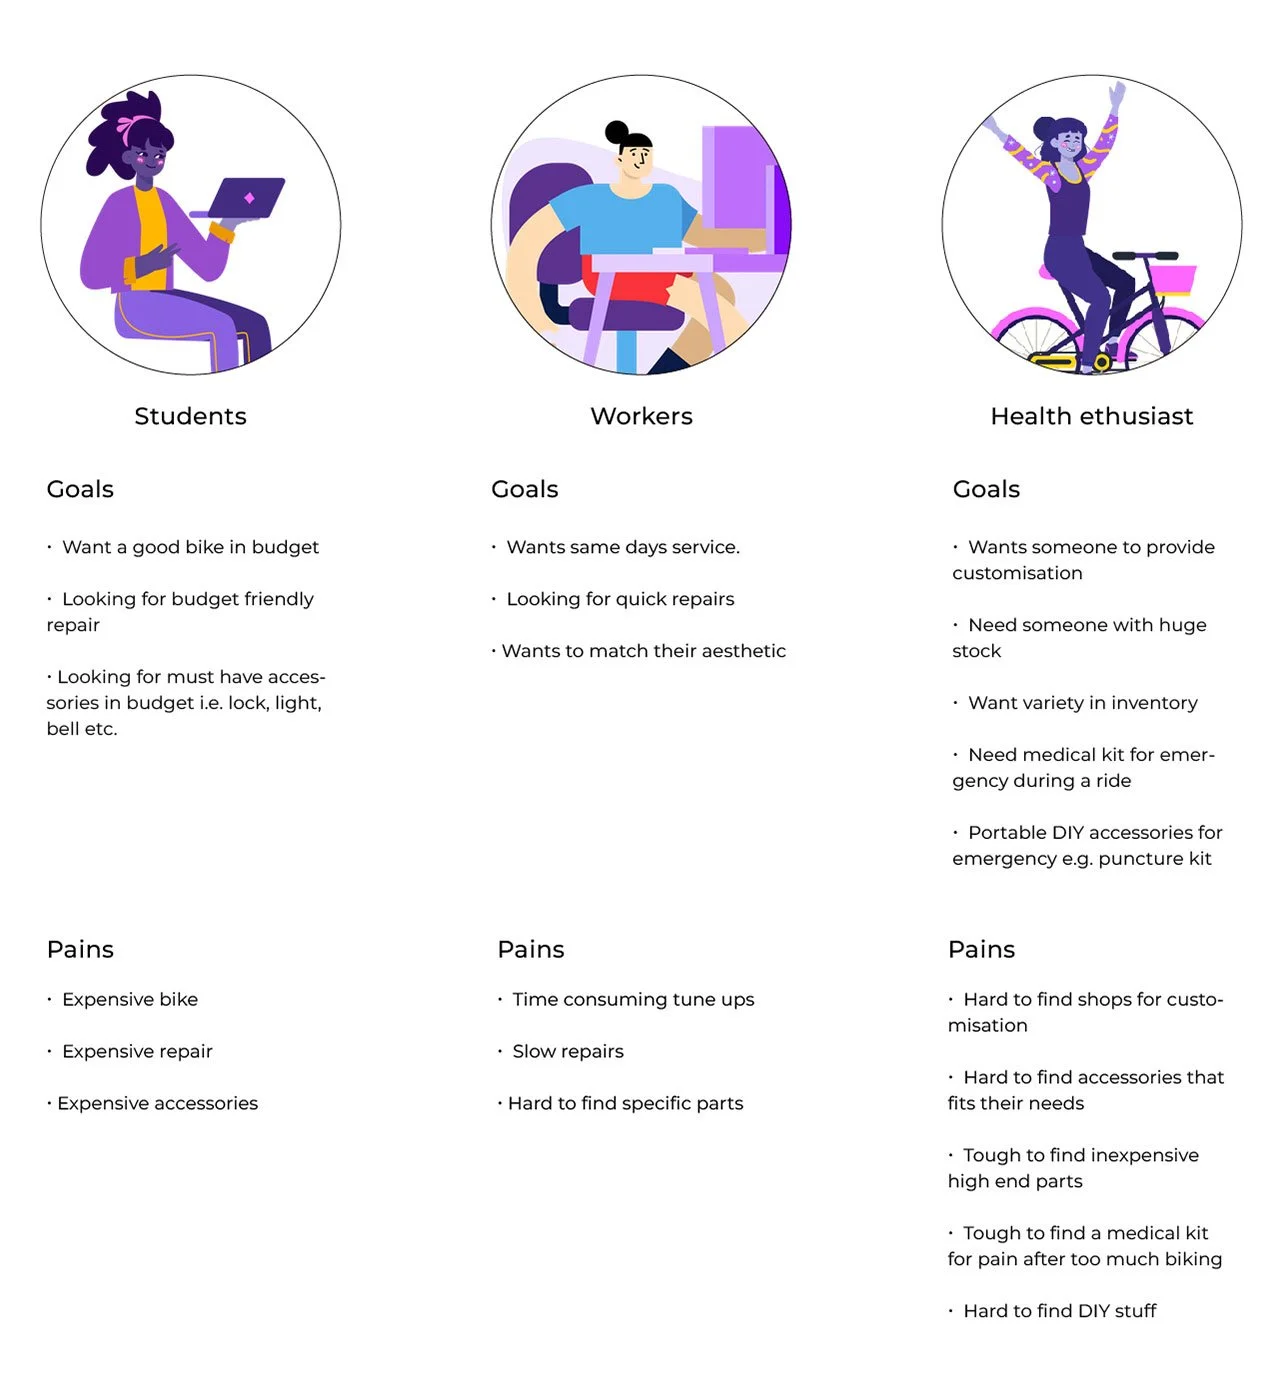
Provisional Personas
The information that I gained from the secondary research helped me create a provisional persona through which I identified the potential customers of TBR. These provisional personas helped me set the standards for the participants of the interviews and also helped me understand what my users needed.
User Interviews
Now this was the time to verify these provisional personas through user interviews with TBR’s customers. During these interviews i asked open ended question to learn as much as I could about their experiences and identify what the user’s needs truly are.
I conducted interviews with 5 people, about 15-20 minutes each.
How often do you visit bike shops?
Tell me how you look for a bike shop for a purchase or repair.
What motivates you to take your bike for a repair?
What factors influence your decision on which bike shop to visit?
What do you use your bike for?
some more questions
When I was done with my interviews I took all the information that I gathered then I synthesized it to better understand who the users are.
Empathy Map
With help of and empathy map, I synthesise all the information that i collected from the user interviews to dive deeper and identify the TBR’s user group.
First, I started by categorizing my notes into the categories of Doing, Thinking-Feeling, Seeing, Hearing, Gains, and Pains to get an overall understanding of everything learned during my interviews with the different participants.
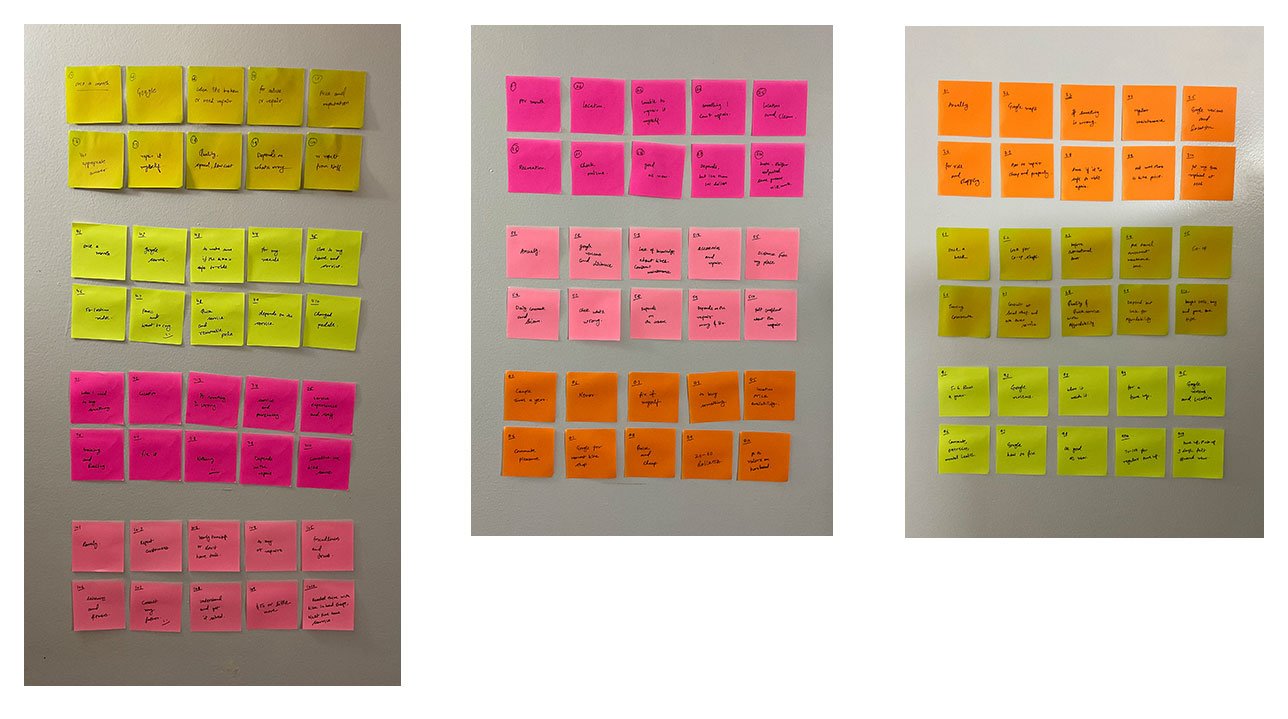
This helped me to uncover common patterns that led to key insights which would help me identify what our users’ needs truly are
-
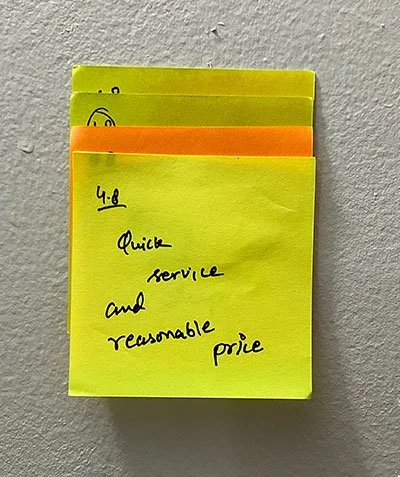
QUICK SERVICE & AFFORDABILITY
Everyone shared that price is the second most important factor when using a shipping service.
-
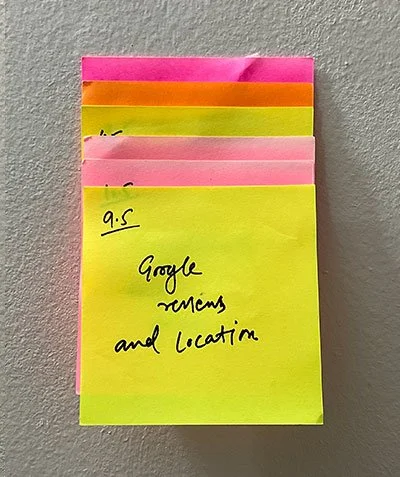
GOOGLE REVIEWS & LOCATION
Everyone shared that safety is there first priority. They don’t there stuff to be damaged, stolen, or replaced by the fake one.
-
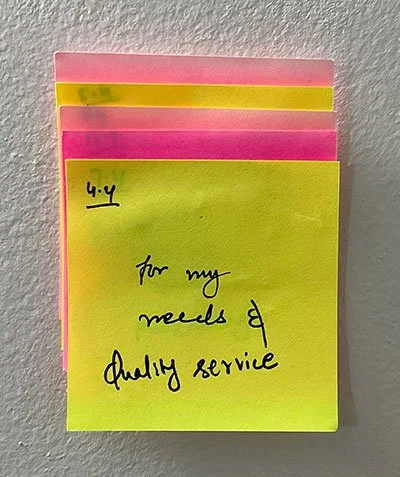
QUALITY REPAIR
Most of them want the deliveries to be faster at a cheaper price.
insights
People prefer to go to a bike shop with quick and affordable service
People prefer to visit a bike shop that has the best reviews and is located near to them.
People generally visit a bike shop for a repair rather than to buy something.
needs
To know if a bike provides a quality service, is it quick and is it affordable.
To know what how far it is located and what other people say about a bike shop.
To know if a bike shop provides the best service.
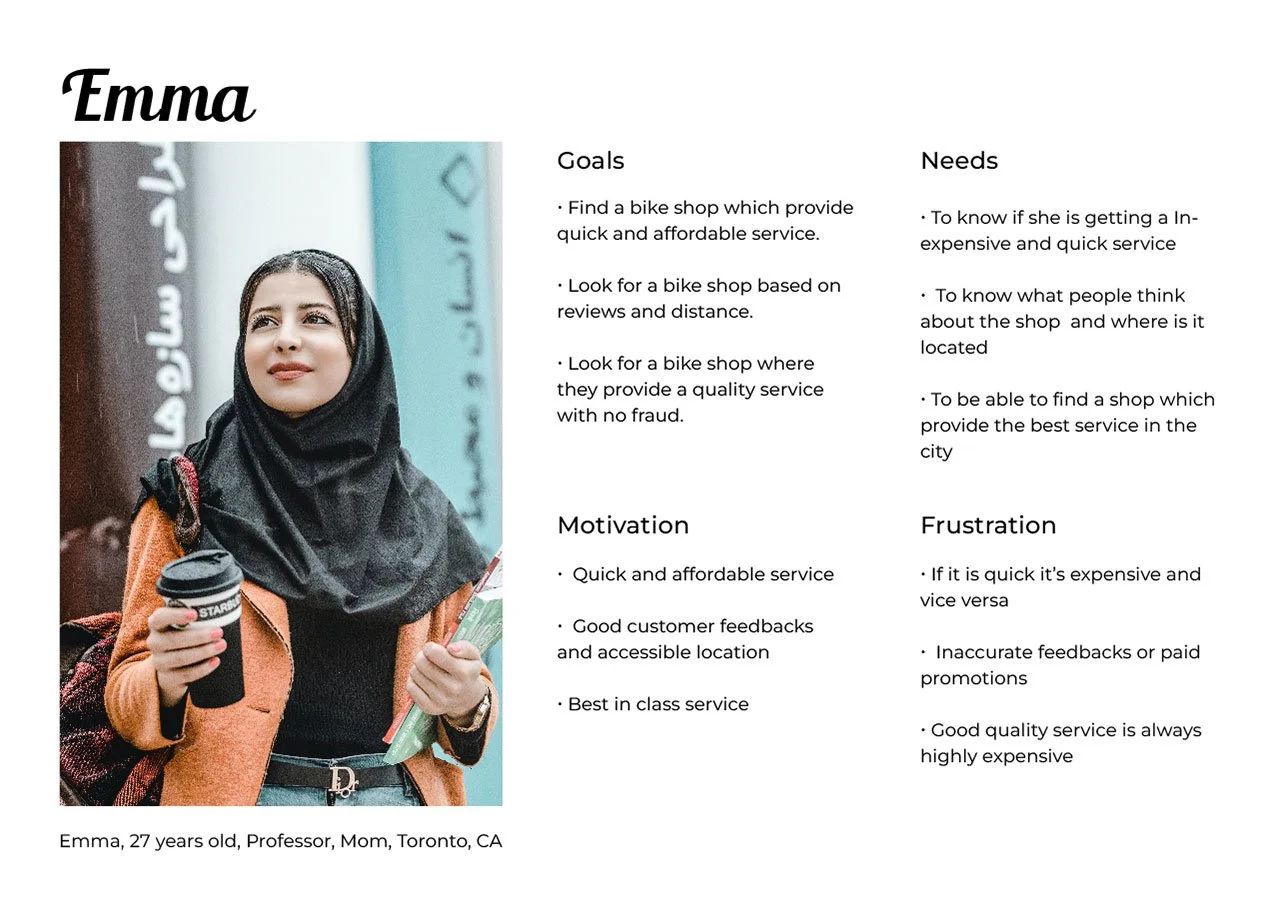
User Persona
With the help of my secondary and primary research, I was able to get an idea of who TBR’s target users are and created a persona that would precisely describe them - meet Emma! This persona will help me making decision in the future according to the needs of our user Emma.
DEFINE & IDEATE
defining the problem
As we now know our target user, Emma, so it is the time to actually find our problems and solve on the basis of what we learned about our user till now.
To help define these problems, I used the insights gained from research and my understanding of Emma’s needs to create POV Statements to frame the problem from the user’s perspective. I used these POV Statements to identify How Might We questions which would fuel my process to brainstorm solutions.
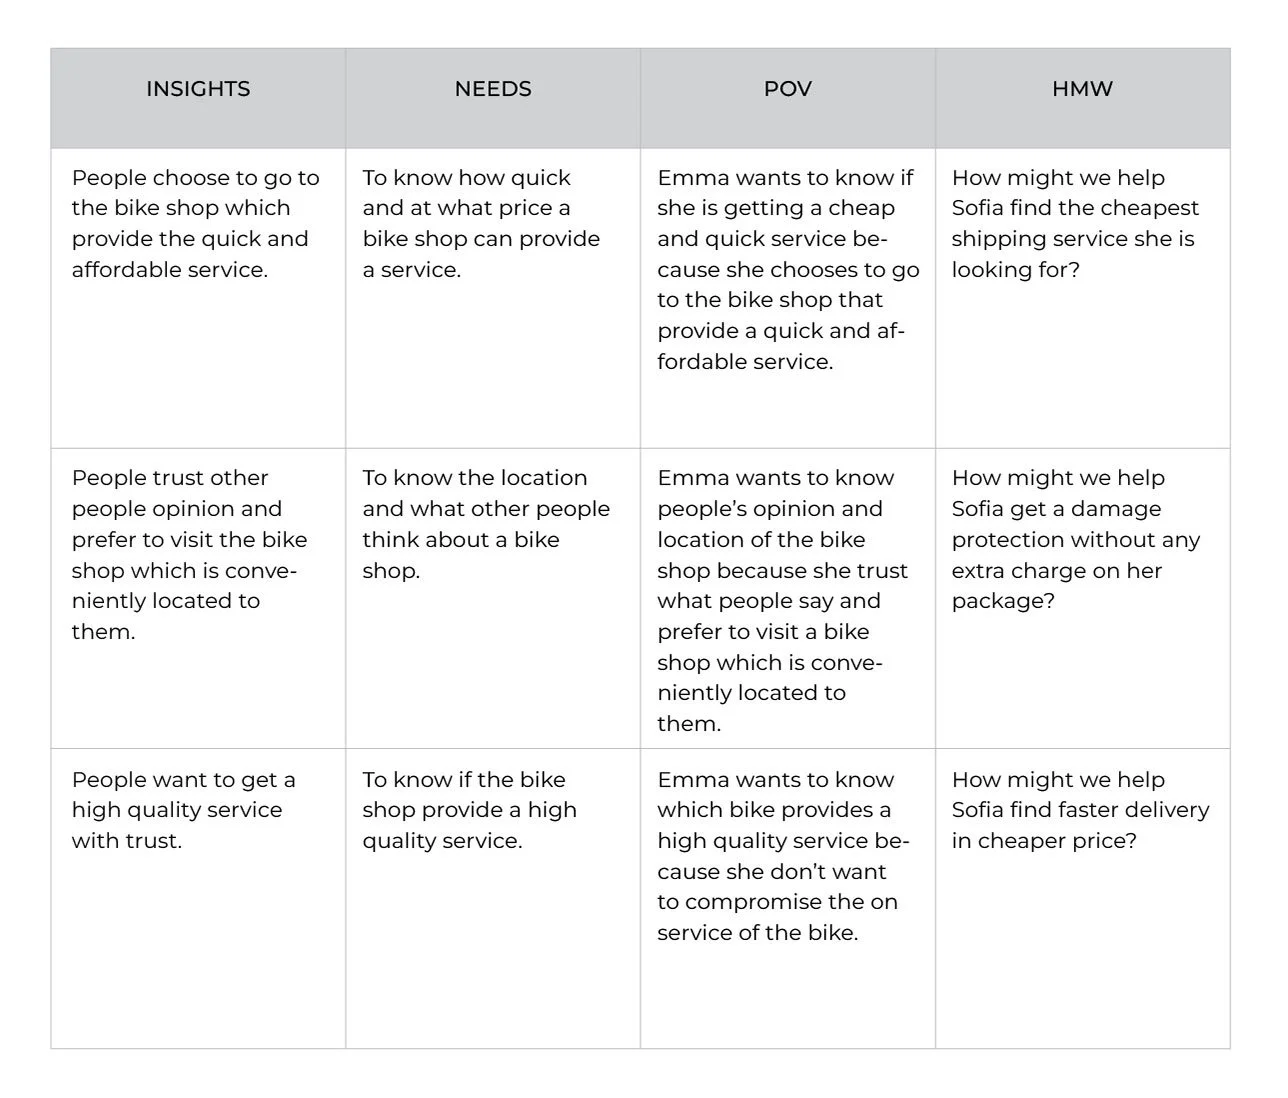
Brainstorming
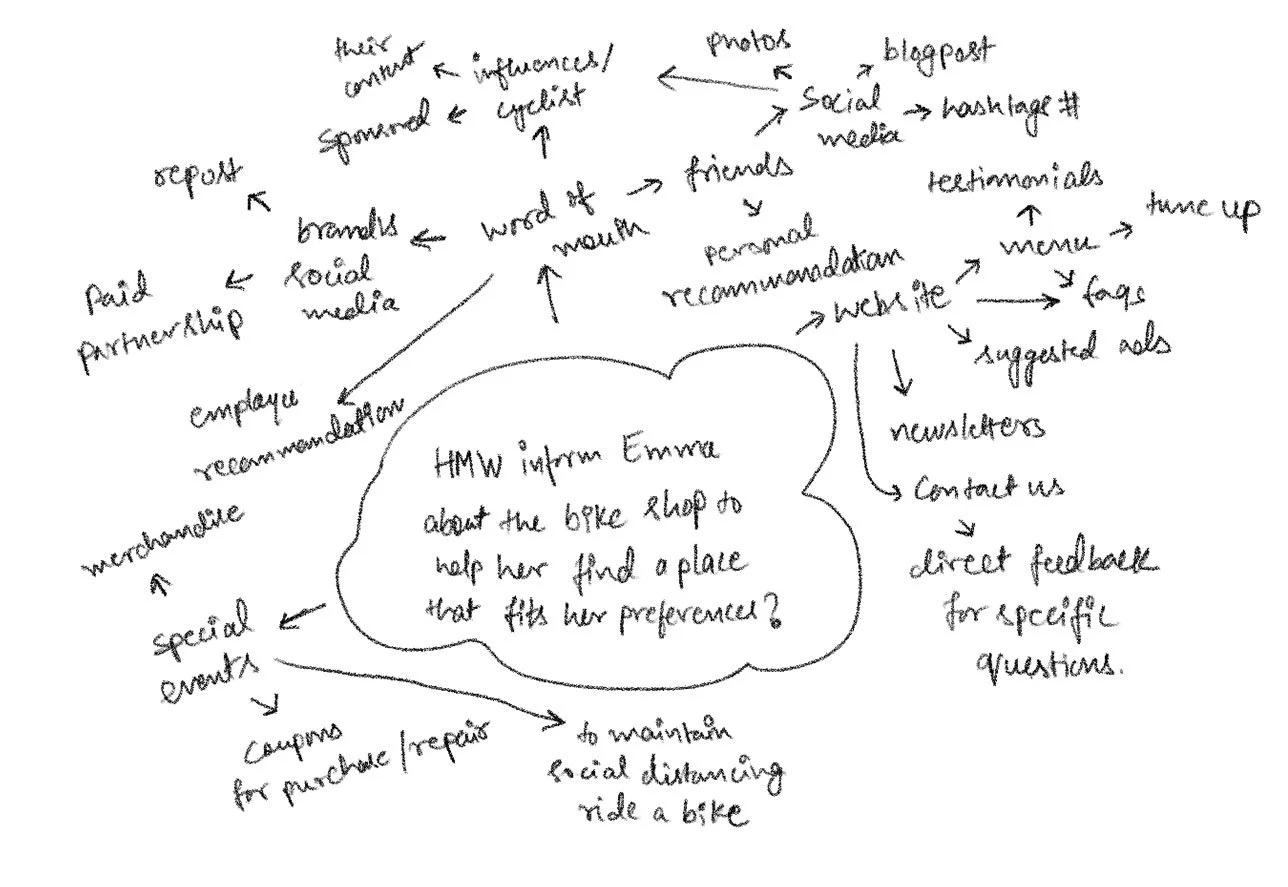
Since I knew what issues we expected to tackle for Emma, I began my brainstorming process to come up with the answers for those issues. I utilized the HMW questions that I recognized and utilized those to assist me with brainstorm various thoughts through mind mapping.
How might we help Emma find the perfect carrier that fits her needs?
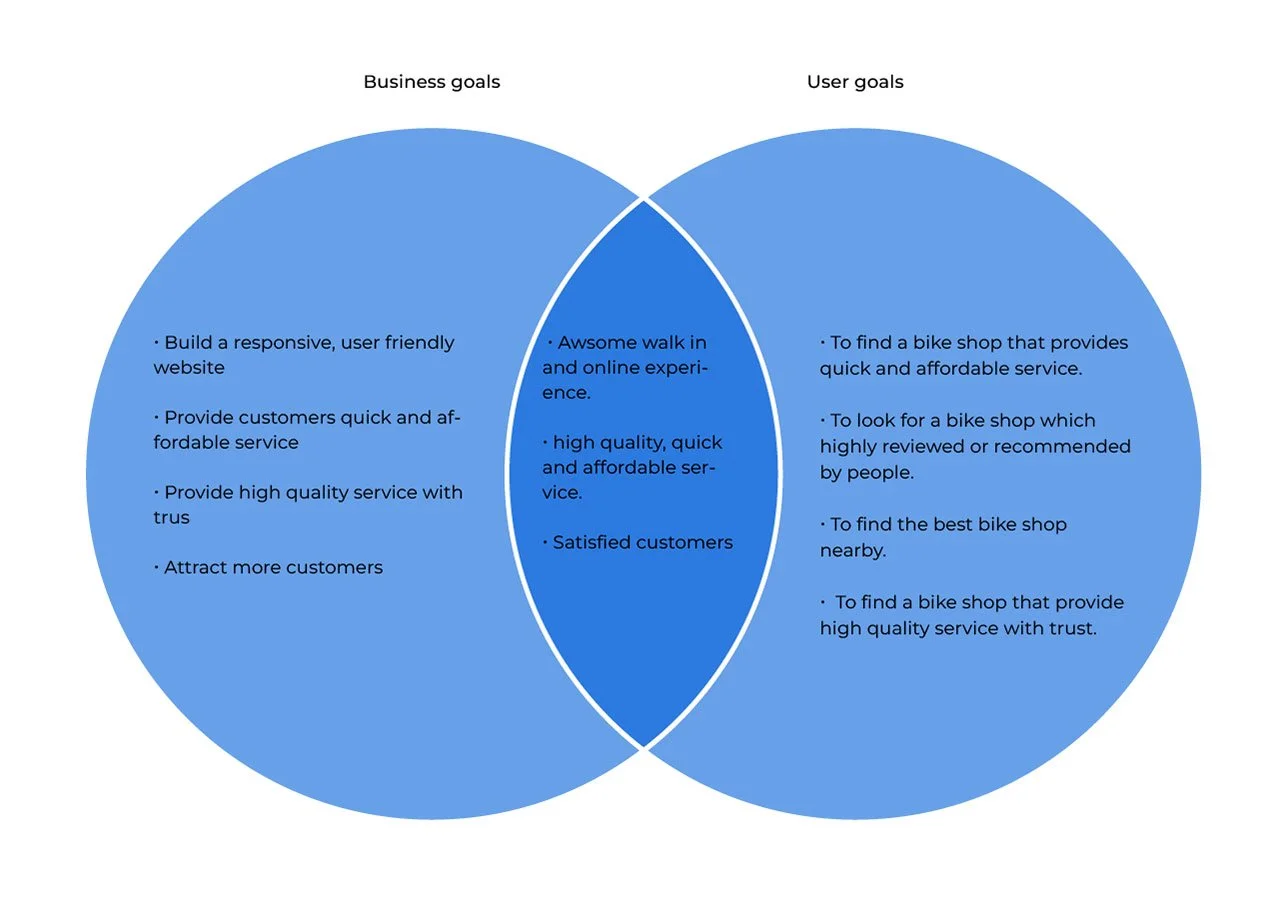
Project Goals
Before I could settle on any choices on what sort of solutions we needed to carry out, I expected to have an unmistakable understanding of the objectives we are attempting to meet. These goals would assist with directing the choices made pushing ahead to guarantee we are moving towards the right direction.
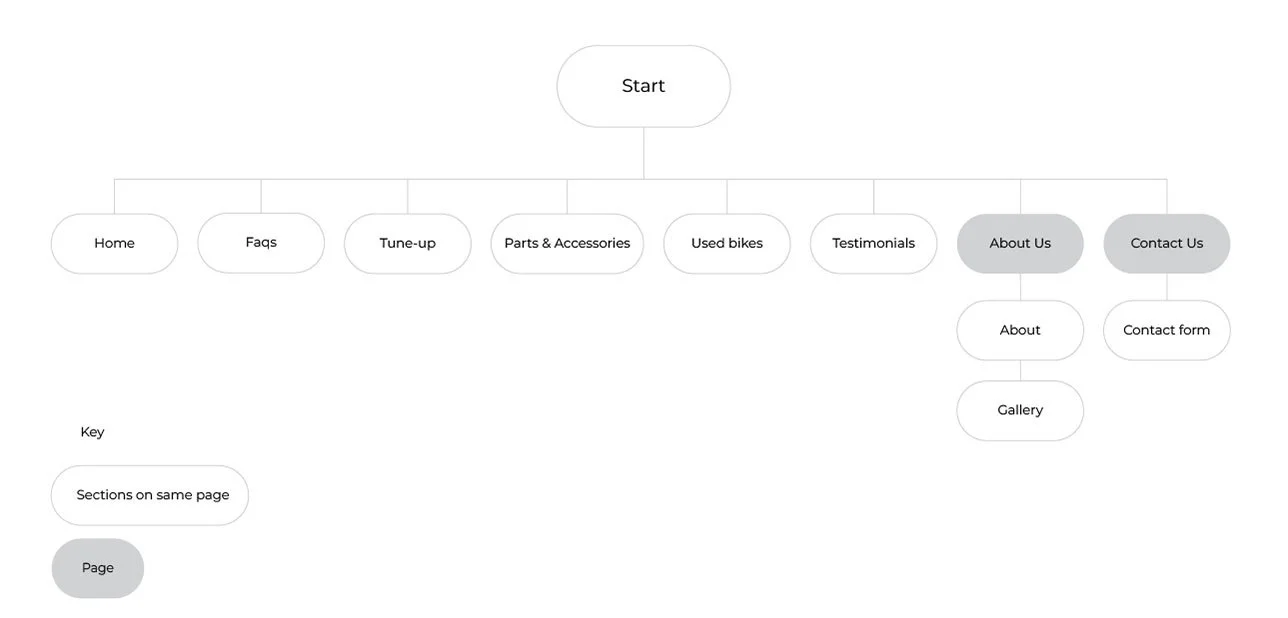
site Map
So now we know our priority goals from which I choose one i.e. creating a website and creating a site map to understand the content structure on TBR’s website in such a way that it would be logical and easy to navigate for our users.
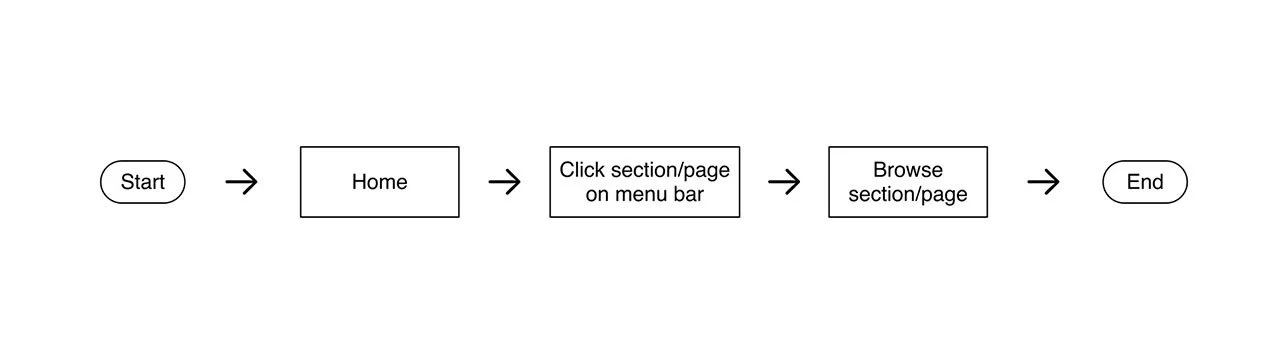
Task Flow
Then, I needed to figure out how the users would interact with TBR’s website. I began by recognizing the key undertakings Emma would be finishing on TBR’s website, based on her goals, and the key pages and detailed requirements that would help her complete those tasks outlined in a UI Requirements docu
Using these key tasks identified based on Emma’s goals, I started to explore how Ashley would interact with the website to complete these tasks by creating task flows.
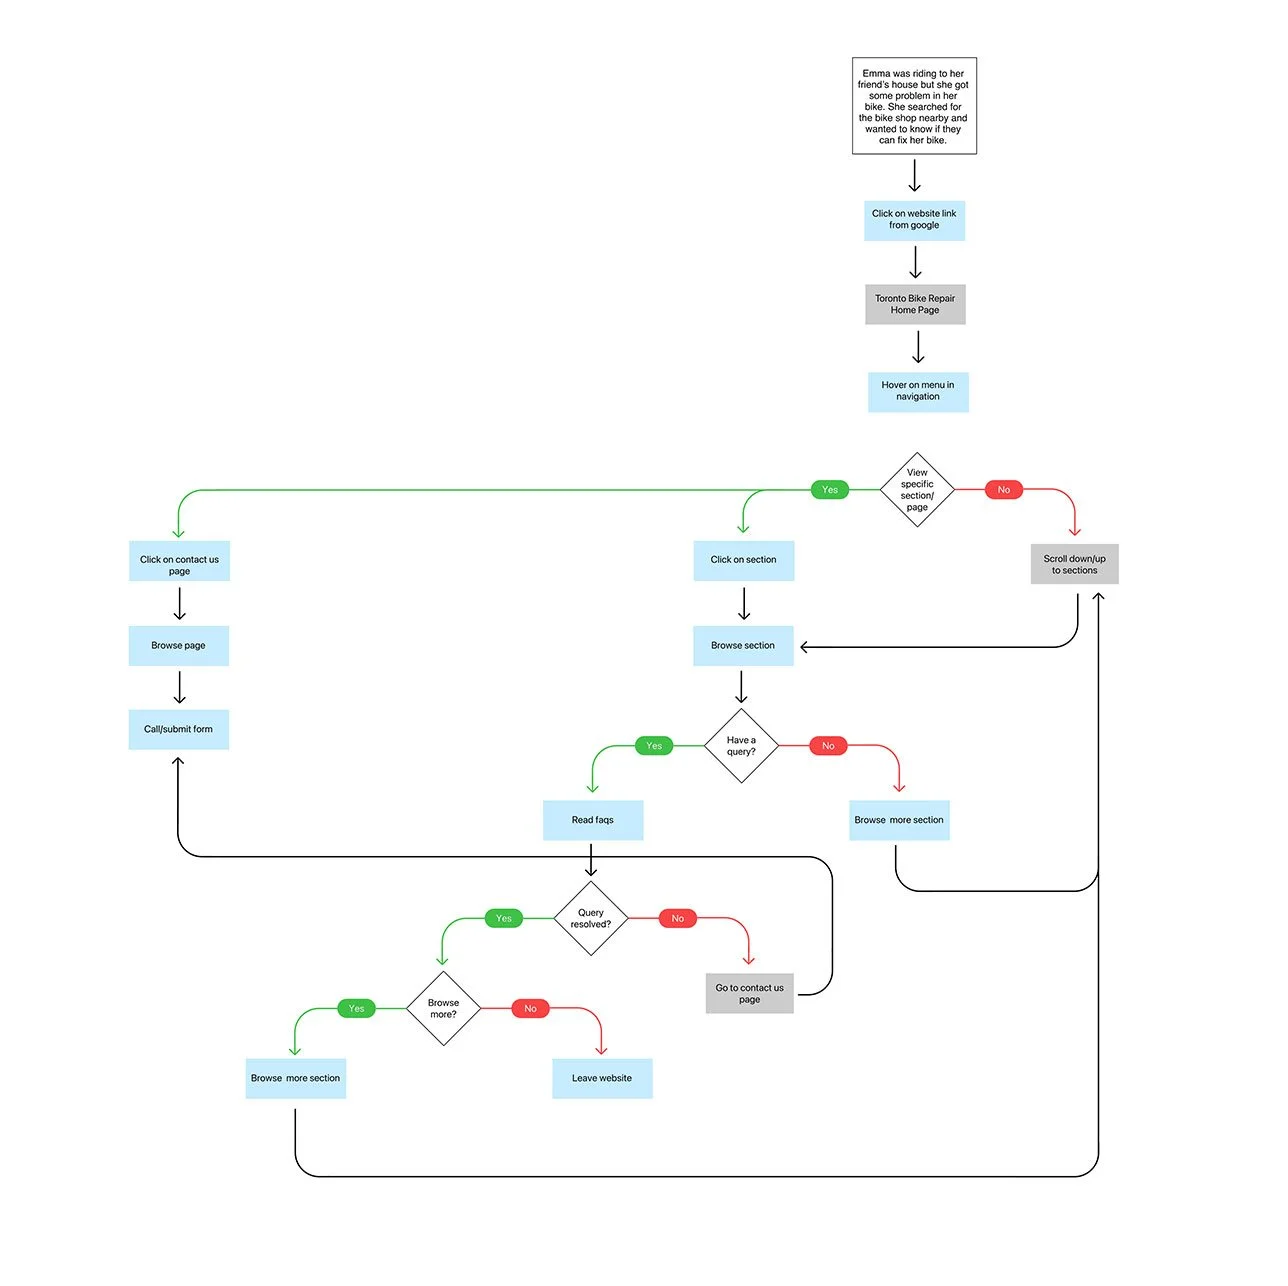
User Flow
In order to empathize with Emma further, I created user flows in order to better understand her overall journey interacting with the website - taking a step into her thoughts and the different decisions she would make while trying to complete tasks in different scenarios
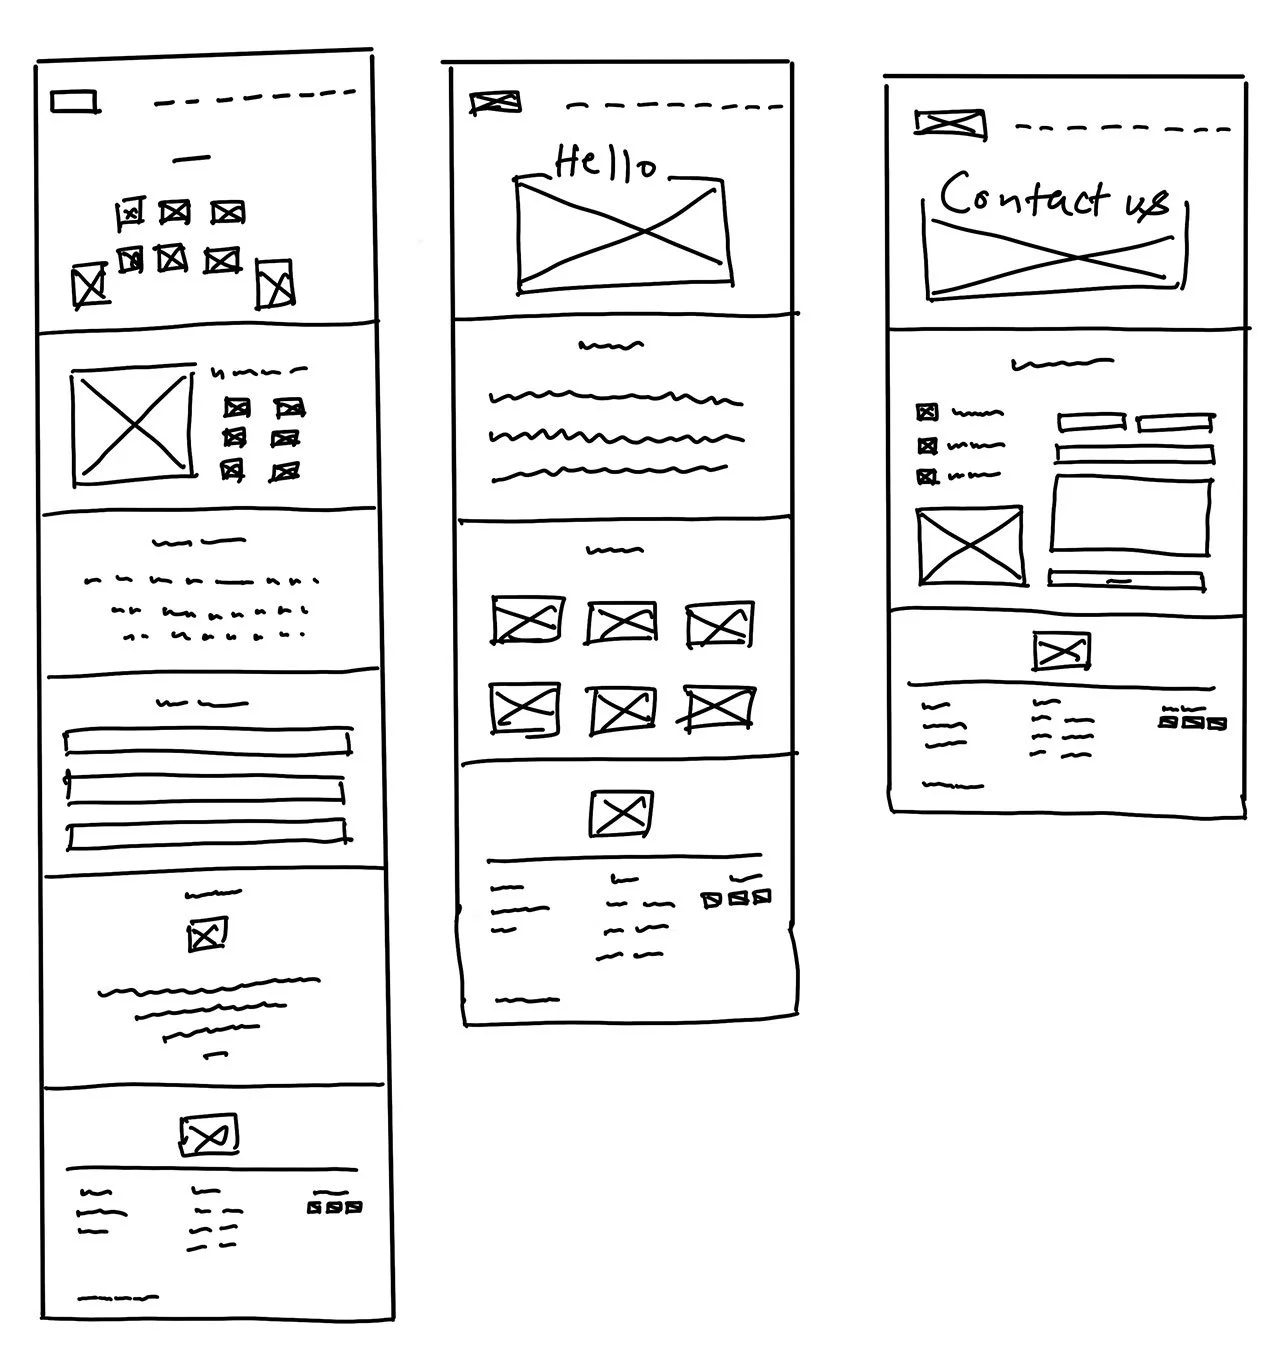
Lofi Wireframe Sketches
Taking what I've realized all through my interaction to this point, I began to settle on choices on how the content on TBR's website would be organized in light of the venture objectives we need to meet.
PROTOTYPE & TESTING
Building a Prototype to Test
In order to make sure the design decisions I made in the lo-fi wireframes successfully help with arriving at our project goals, I needed to reach a place where we could test the design with genuine users.
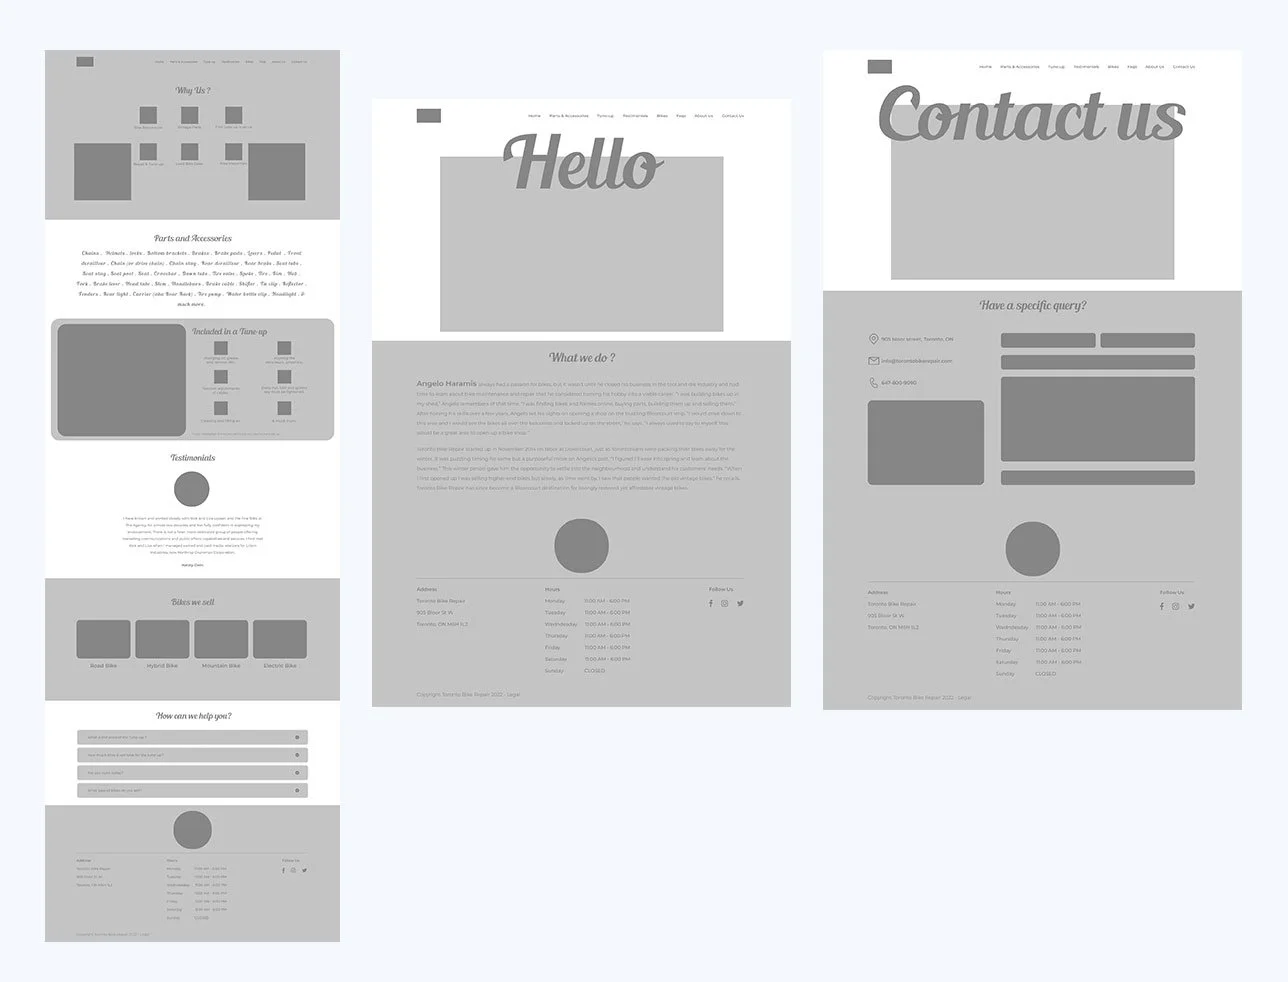
Mid-Fidelity Wireframes
Taking the lo-fi wireframe drawings, I digitized them on Sketch and added barely sufficient data for users to have the option to explore through the pages and complete tasks I would present to them during Usability testing. These mid-fidelity wireframes would help my focus on what should have been worked on as far as the usefulness of my design. I additionally made tablet and mobile versions to ensure that the design is responsive and viable across the different gadget screens that users would get to the website on.
Mid-Fidelity Prototype
Taking the wireframes, I then worked on creating a mid-fidelity, limited functionality prototype, using Figma, to use for usability testing.
Usabilty Testing
After completing my prototype, I began working on a plan to conduct a testing of the prototype. With the help of bunch of participants as they interacted with the design I realized that there is some space in my design where improvements needs to be made.
TEST OBJECTIVES
Test if users can easily complete the tasks.
Observe the different paths users take to complete tasks.
Assess areas of improvement to improve the usability of the design.
TASK
Learn more about Toronto Bike Repair’s background.
Find out where Toronto Bike Repair is located.
See what is the price of their Tune-up.
OVERVIEW
Method: In-person, moderated usability testing (Think Aloud)
Participants: 5
Age range: 20 - 30
Average Time: 7 minutes
Task Completion Rate: 100%
Error-Free Rate: 99.4%
Overall, the testing showed positive results, but there were distinct areas in which users did face difficulties.
Affinity Map
Understanding the observation more clearly from testing, i took help of an affinity map synthesize my findings. Which help me to understand different experiences of user while interacting with the design. And those insights help me identify what improvements need to be made on our design to make sure we are helping out users painlessly meet their goals.
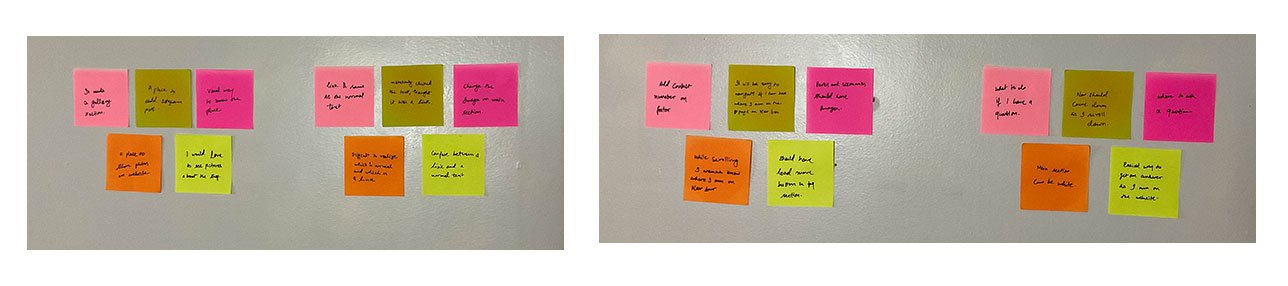
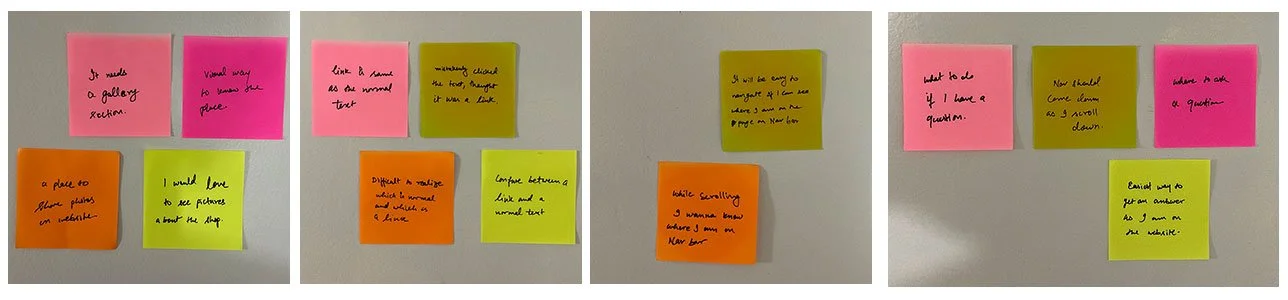
Amongst the patterns I uncovered, I was able to identify common pain points amongst our participants:
PAIN POINTS
4/5 want a gallery section to know the look of the shop.
3/5 user want their answer as soon as they are on the website..
4/5 had some confusion about what text is clickable or hover-ankle.
2/5 user did not know where he was on the menu bar while scrolling
INSIGHTS
People want to see pictures of the shop for daily work.
People want the answer to their queries as they visit website
People were confusion about which text is a clickable link.
People had no idea where they were on the screen as they saw nothing in the menu bar.
RECOMMENDATIONS
Add a gallery section on the About Us page.
Relocate the FAQs section below the main section
Change the Color of the text on hover to active link color.
The menu bar shows on scroll with active links according to the specific section.
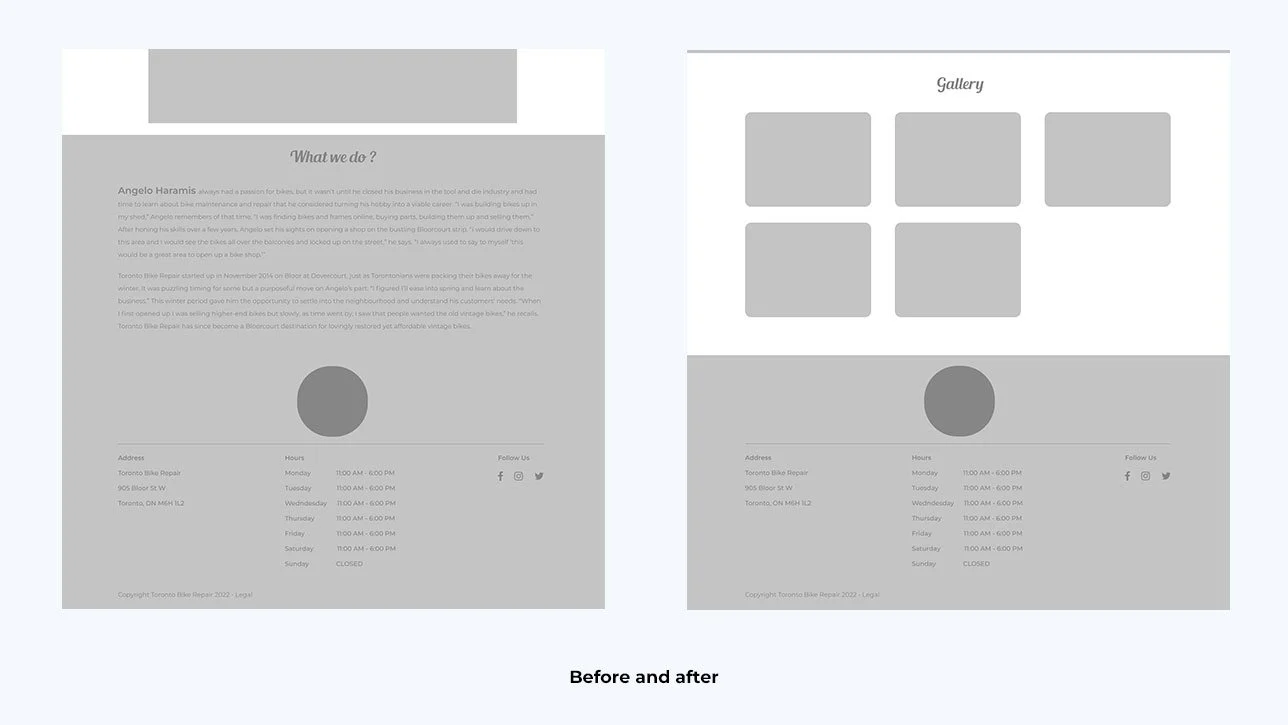
Priority Revisions
With what I learned from the affinity map, I started making revision in the design to improve it.
1.Add a gallery section on the about us page.
People want to know more about day to day activities of the bike shop, so I added a gallery section on the About Us page because it is about the bike and we can some other pictures as well like from history, etc.
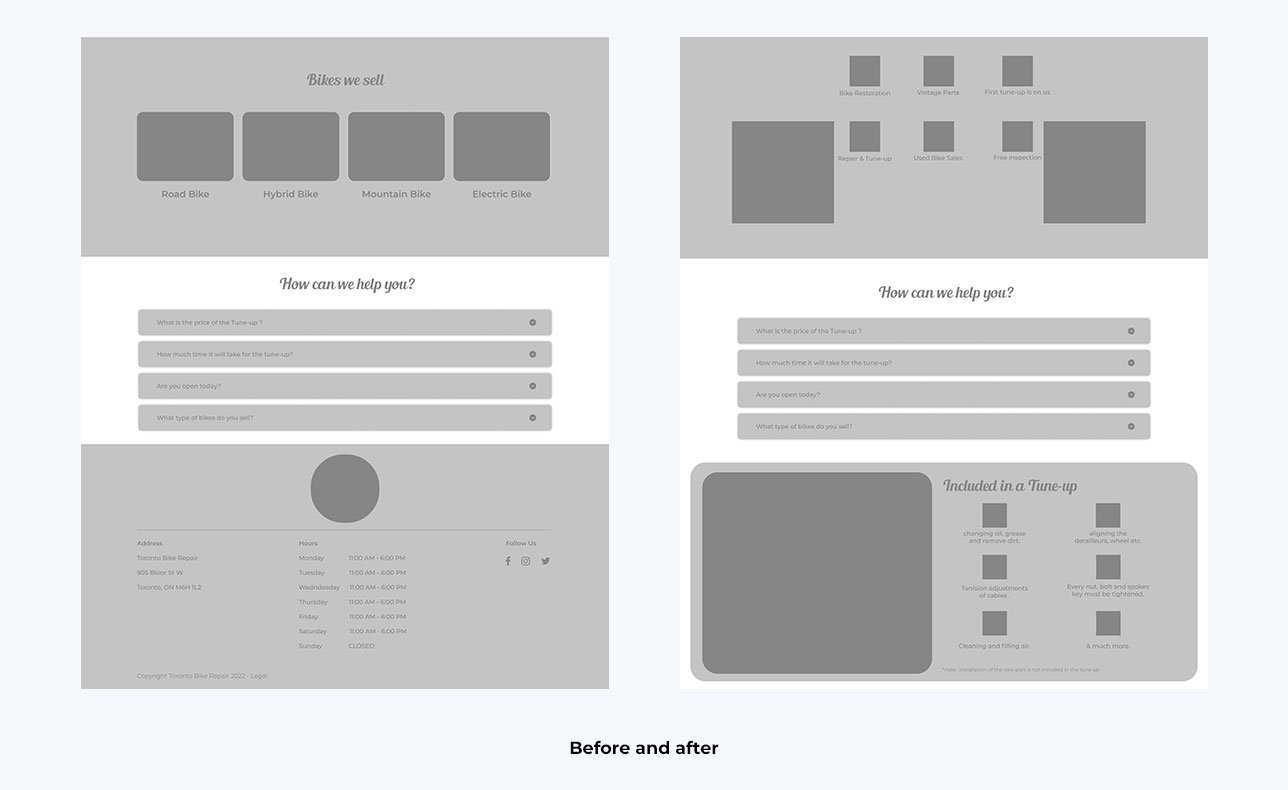
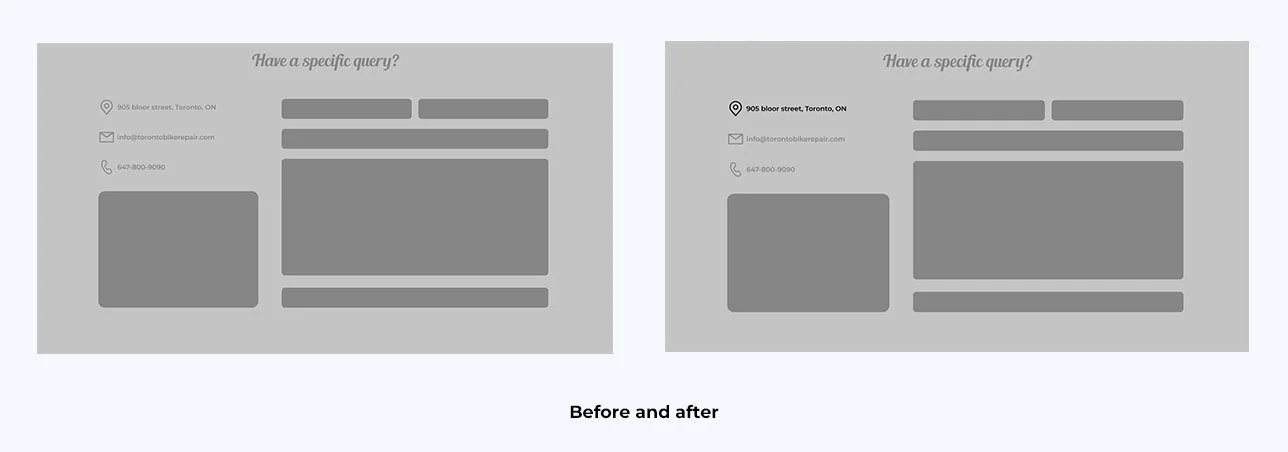
2.Relocate the FAQs section below the main section..
It is not always the case that a person wants to call for a small thing, as it can be embarrassing but it is necessary for them to know, so adding a FAQs section just under the main section as it is easily accessible and answers their questions quickly.
3. Active link text change color on hover.
People were confused about which text was an active link or which was just a normal text, so to differentiate between them, the link text would change color to the primary color of the website while hovering.
4.Tabs on menu bar will change color on scroll according to the section they are..
People were confused about which section they were in while scrolling and scrolling back to the top just to check. So while scrolling tabs on the menu bar will change color according to the section they are at.
UI DESIGN
Branding
After we are done with all the changes in UI according to feedback and recommendations we got from the affinity map, now it is time to match the branding according to the new UI design. So I worked on updating the TBR’s Branding so that it’s unique brand identity can effectively communicate with the website.
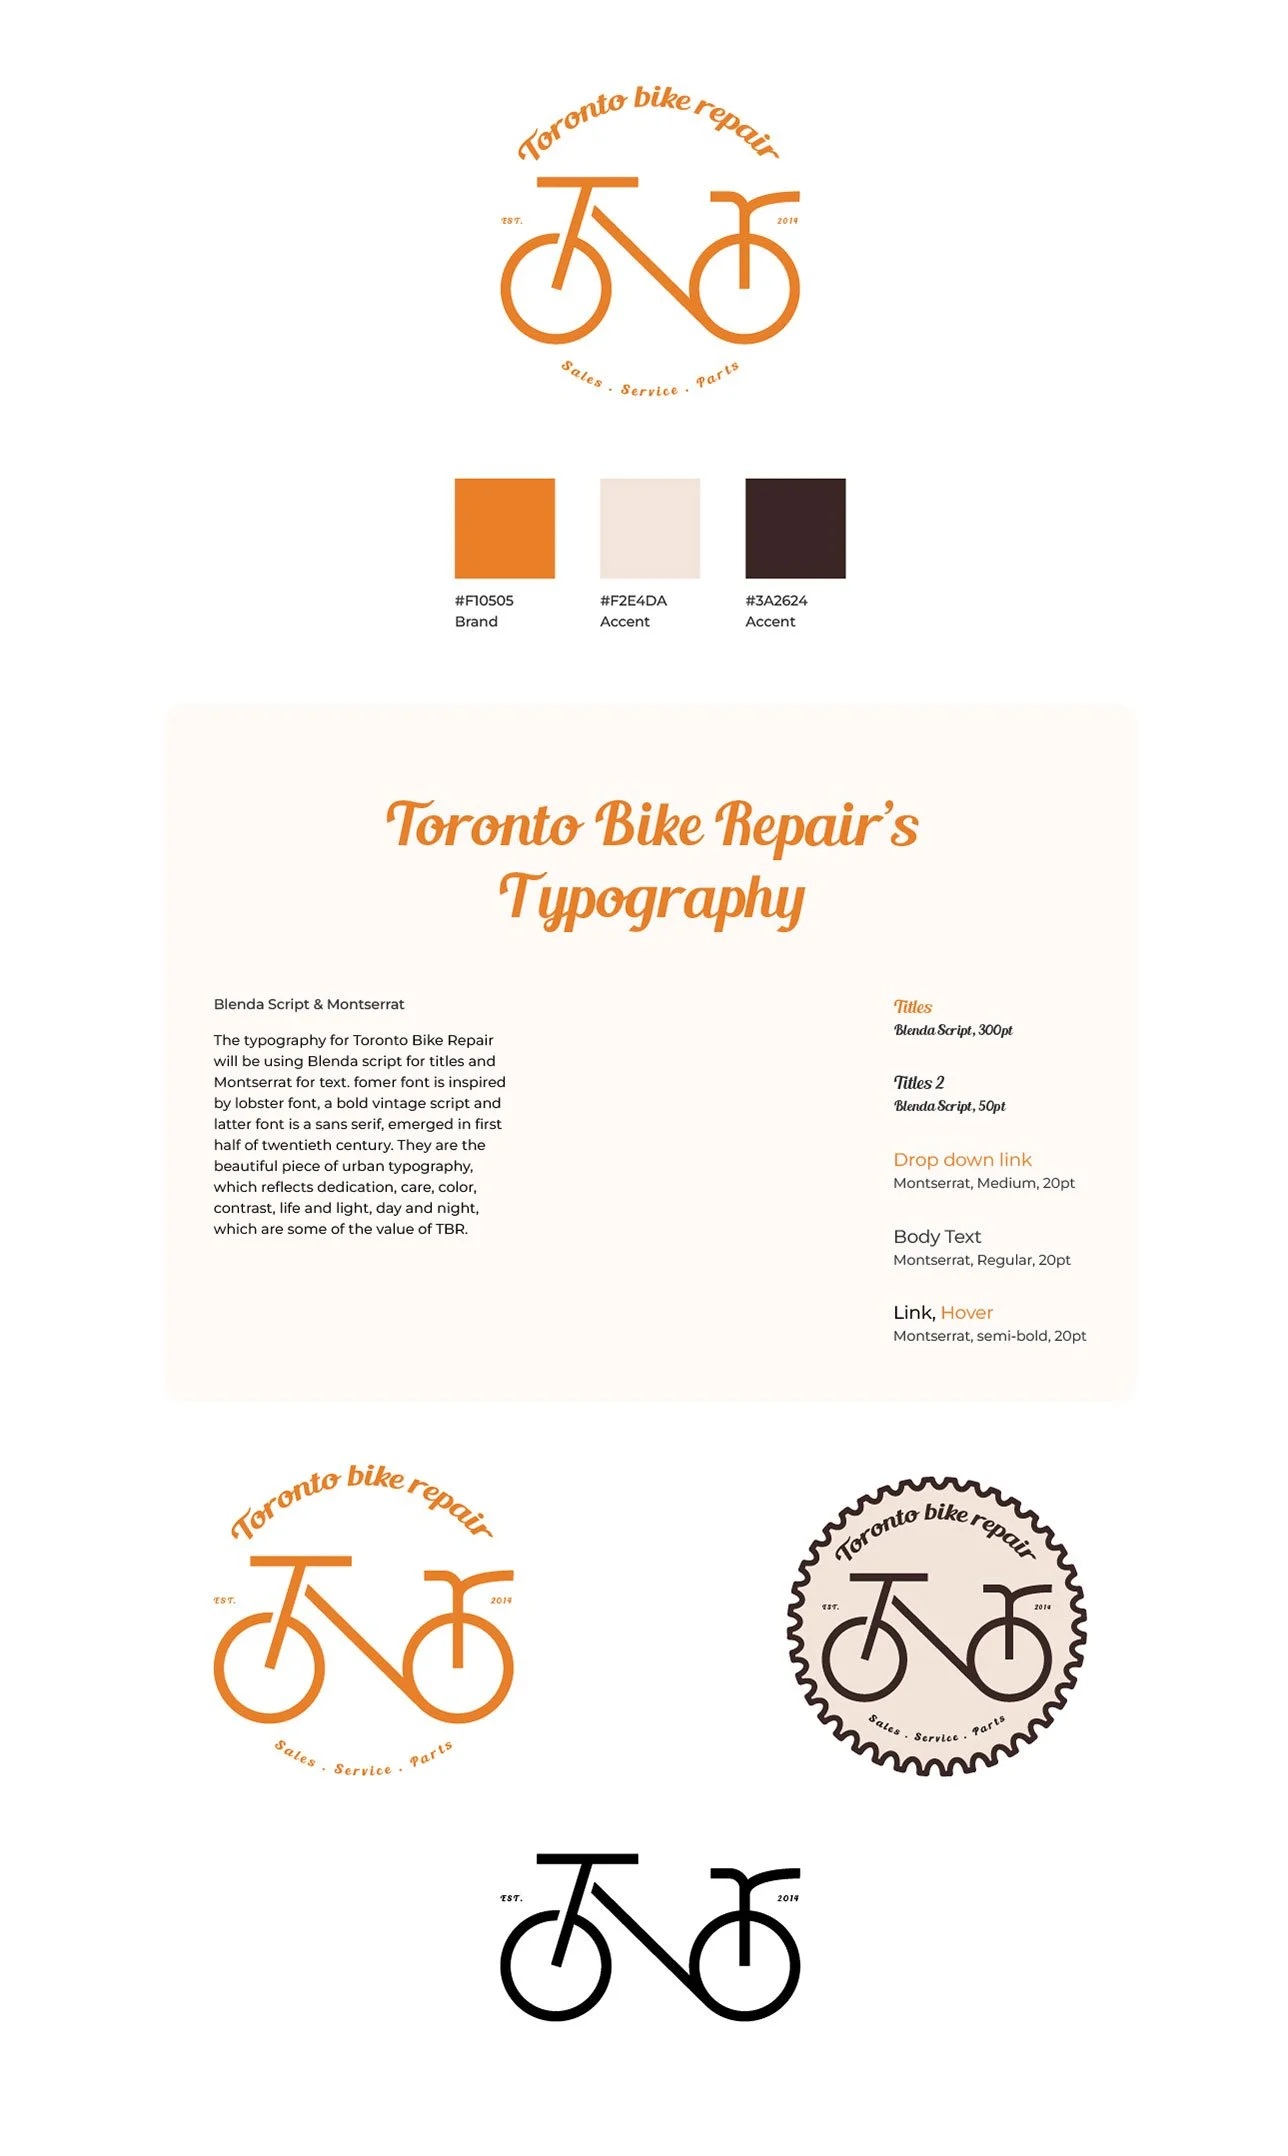
Logo Design
After the name logo is the most important thing of a brand identity, it should be something that just by looking at the image a person knows it’s TBR’s logo. Hopefully, I had a lot of different references, and I knew what I wanted, so I started sketching and my father helped me a lot to come up with this design, Thanks to him.
Style Tile
TBR’s started as a vintage bike shop but they work with every kind of bike, so just to keep that the soul of the bike shop is vintage. I created a style tile with the colors and aesthetics kept in mind. Then I compiled everything together and set a direction in which TBR will move with its branding.
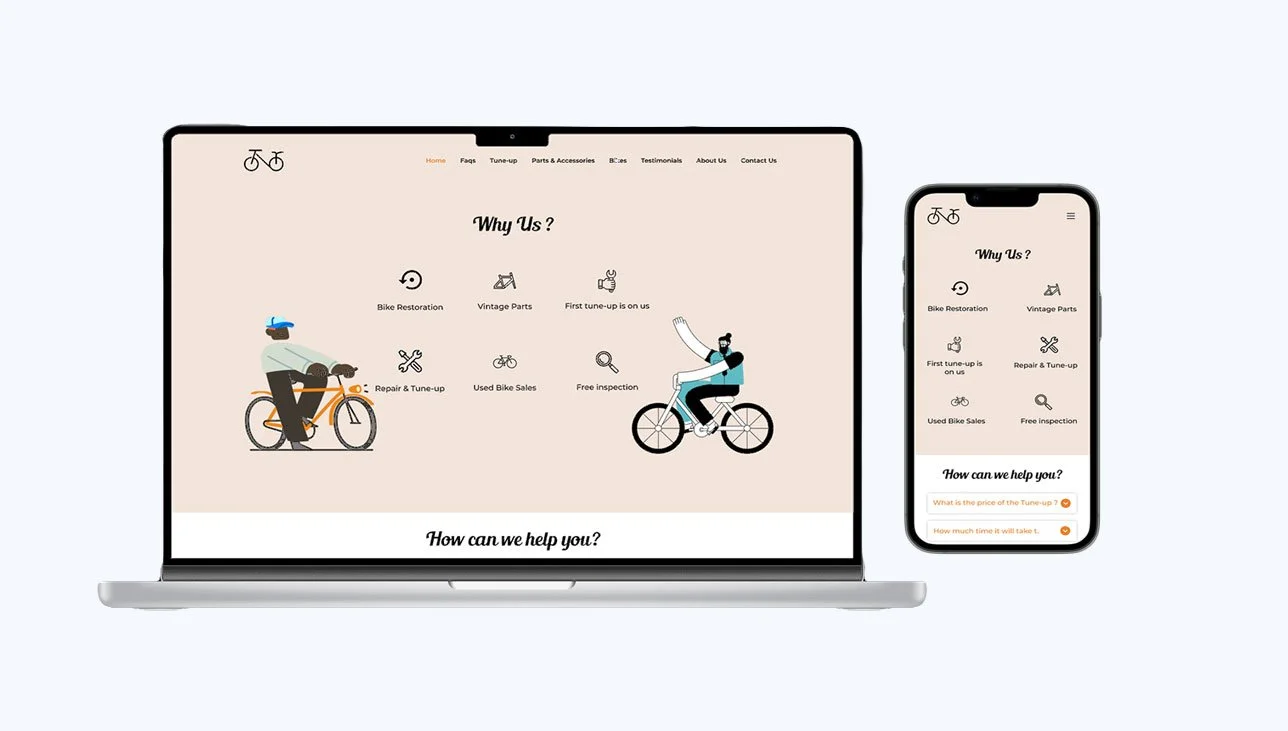
Final Prototype
Taking my revised wireframes, I now worked on creating final, high-fidelity wireframes and created a final prototype.
Reflection & Next Steps
Being a bike enthusiast I really enjoyed working on this project, I got to know a lot about bikes, the way people think about them, and how they use them. While doing competitive analysis I explored some new accessories which I did not know that they existed and saw some really high-end bikes. Most importantly I learned how technology is shaping this industry and can help customers to meet their goals effectively. If I were to push this project further, I would:
RE-TEST
Now that I made revisions to my design and added the visual elements, I would like to test and validate the changes made and observe if any further improvements need to be prioritized.
PRODUCT LAUNCH
With the completed product, we would be able to introduce their new branding and launch the website.
HAND-OFF
With a finalized version of the design, I would then present the final design to stakeholders and hand it off to developers to build the website.
ADD FEATURES
With the timeline of this project, I could only focus on the top prioritized features to meet our project goals. However, I think there’s room to add more value and delight to the experience by implementing other features referenced on the product roadmap.